Every Moat in B2B SaaS Is Shrinking. Here's What I'm Doing About It.
Every Moat in B2B SaaS Is Shrinking
TL;DR: AI is commoditizing SaaS features faster than ever. Use this 7-vector defensibility framework to score where your startup is genuinely strong vs. exposed. Methodology lock-in and switching costs matter most — everything else can be cloned.
AI can replicate in a weekend what took a team 6 months. Dashboards, analytics, "proprietary" algorithms — all commoditizing faster than anyone expected.
This kept me up at night. So I built something to force myself to look (here's how I built it).
The Problem with Vibes-Based Competitive Analysis
Most founders track competitors by vibes. "They raised $10M, we're screwed" or "they haven't shipped in months, we're fine." Neither tells you where you're actually defensible.
Quarterly competitive reviews are worse. By the time you sit down to update a spreadsheet, the signals are three months stale. A competitor shipped a free tier. Another got acquired by a platform your customers already use. A new entrant appeared with VC money and your exact positioning.
By the time you notice, you're already behind.
A Framework for What Actually Matters
I built a Claude Code skill that runs a competitive reality check on demand. It searches the web for what competitors shipped, scores where I'm strong and exposed, and separates signal from story.
It checks seven things — scored 1 to 5, with evidence:
| # | Vector | What It Measures | |---|--------|------------------| | 1 | Methodology Lock-in | Do people use your framework? Or just your features? | | 2 | Data Network Effects | Does the product get smarter with more users? | | 3 | Switching Costs | Are customers staying because they want to — or because they're stuck? | | 4 | Distribution Advantage | Are you finding customers organically, or paying for every one? | | 5 | Speed-to-Value | How fast is the first "oh wow" moment? | | 6 | Pricing Architecture | Does revenue grow with customer value? | | 7 | Technical Differentiation | Could someone rebuild this in a weekend? |
Methodology Lock-in and Switching Costs are weighted 1.5x. Methodology is what makes you irreplaceable. Switching costs are what keeps you irreplaceable.
Running It on Myself
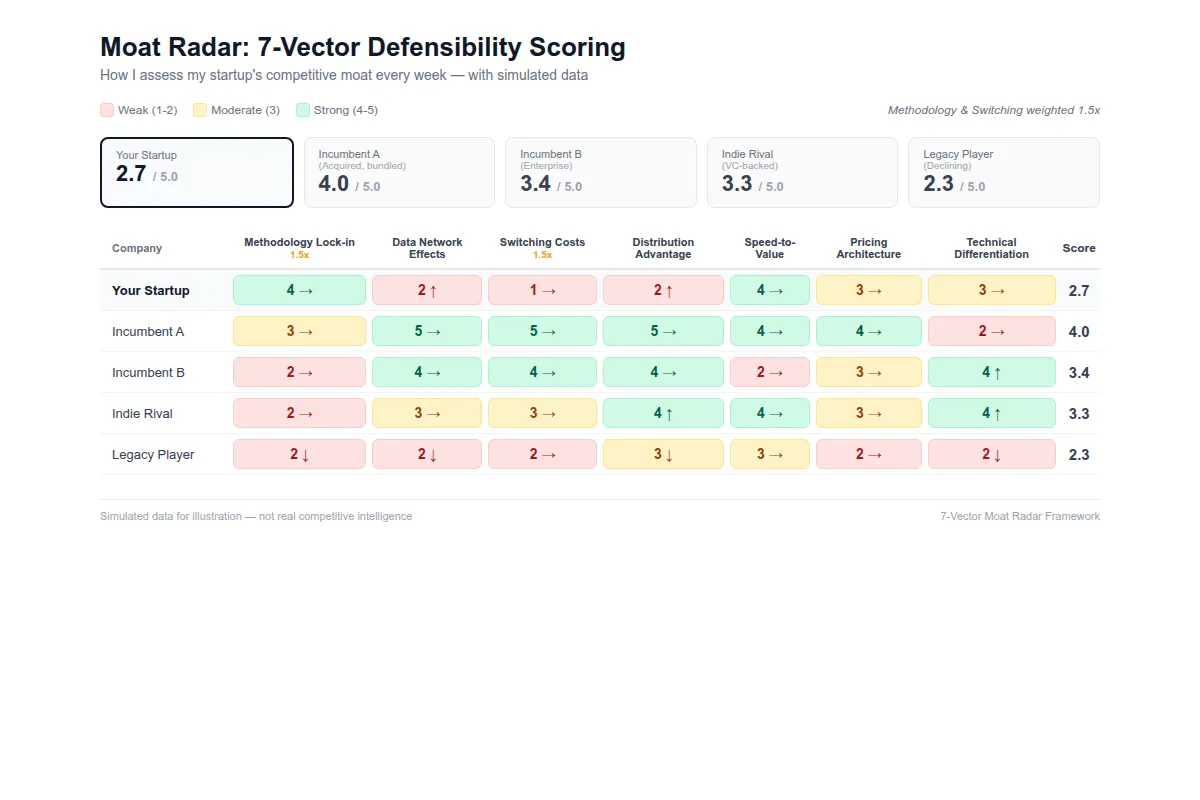
I ran it on my own product first. Here's the heatmap with simulated data (I'm not going to publish my actual competitive scores, but the shape is real):
For the full technical architecture — Cloudflare Worker, D1 database, alert thresholds — see the technical deep dive.
The result that stung most: Data Network Effects at 1/5. Every customer is an island. No cross-customer benchmarks, no aggregate insights that improve with scale. Strong methodology (4/5) but weak compounding.
That 1/5 isn't a failure — it's a roadmap. Every feature I build now gets evaluated against: "Does this make the product better for everyone, not just this one customer?"
What Still Matters When AI Can Clone Features Overnight
The vectors that hold up when replication cost drops to near-zero:
- Data that compounds with every customer. If each new user makes the product smarter for all users, a competitor starting from scratch can never catch up. This is why benchmark databases and aggregate insights matter more than feature lists. This is exactly the pattern behind profit drag analysis — understanding which customers compound your value vs. destroy it.
- Workflow people chose, not got stuck in. Switching costs built on lock-in are fragile. Switching costs built on "this is how I think about my business now" are durable. Language matters — if customers adopt your framework's vocabulary, they're not just using your tool.
- Channels that survive when you stop paying. SEO, content that ranks, community. Every dollar spent on paid acquisition is rented distribution. Every piece of indexed content is owned distribution.
- Speed that compounds. Being faster to first insight is table stakes. Being faster to tenth insight — because the system learned from the first nine — is a moat.
The Uncomfortable Part
Running this monthly doesn't feel good. Seeing 1/5 on a weighted vector when your competitor scores 5/5 is confronting. But the alternative is learning you got disrupted six months late.
You can't fix what you won't look at.
Is your moat wider or narrower than a year ago?
Frequently Asked Questions
What is a competitive moat in SaaS?
A competitive moat is a structural advantage that makes your business difficult to replicate or displace. In SaaS, moats come from proprietary methodology, data network effects, switching costs, distribution advantages, speed-to-value, pricing architecture, and technical differentiation. Unlike features — which AI can now replicate in days — moats are built over time and compound with usage.
How do you measure SaaS defensibility?
Score your product across 7 vectors (methodology lock-in, data network effects, switching costs, distribution advantage, speed-to-value, pricing architecture, technical differentiation) on a 1-5 scale with evidence. Weight methodology and switching costs 1.5x — they're the hardest to replicate. Compare against your top 4-6 competitors. The weighted average is your moat score.
Which moat vectors matter most for early-stage SaaS?
Methodology lock-in and speed-to-value. Early-stage companies rarely have data network effects or deep switching costs. Focus on building a named framework your customers adopt as their own language, and getting users to their first insight as fast as possible. The other vectors compound as you grow.
How often should you run competitive analysis?
Monthly at minimum, weekly if you can automate it. The value is in the trend, not any single snapshot. A competitor going from 3 to 4 on distribution while you're stuck at 2 is a signal that won't show up in a quarterly review.
Ready to see which customers are building — or eroding — your margins? Try Margin Levers free or see pricing.